Information Design
Strategic Infographics
Client: InMoment | Sterling | SAP Concur
Focus: Editorial Layout | Illustration & Iconography


Transforming complex information into accessible, scannable visual narratives
-
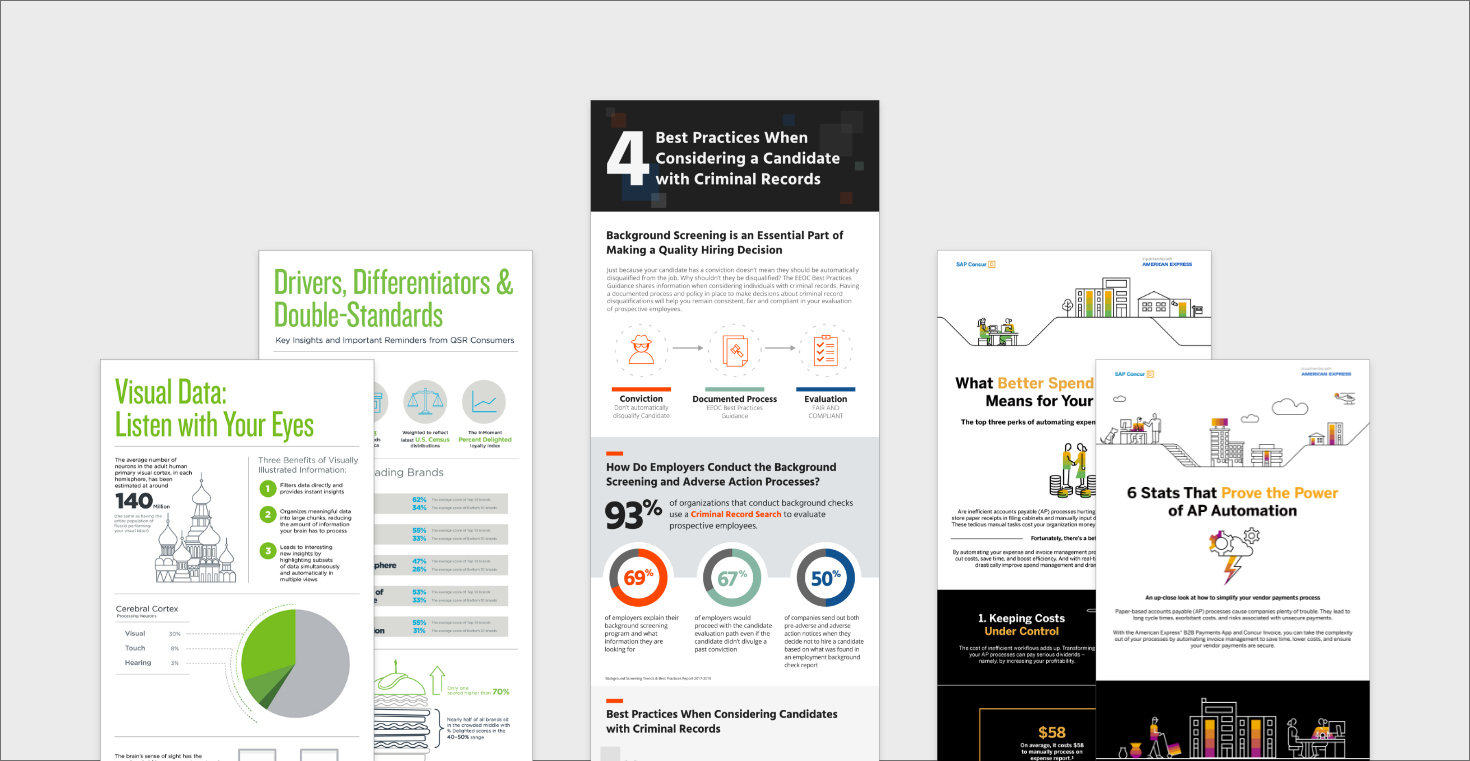
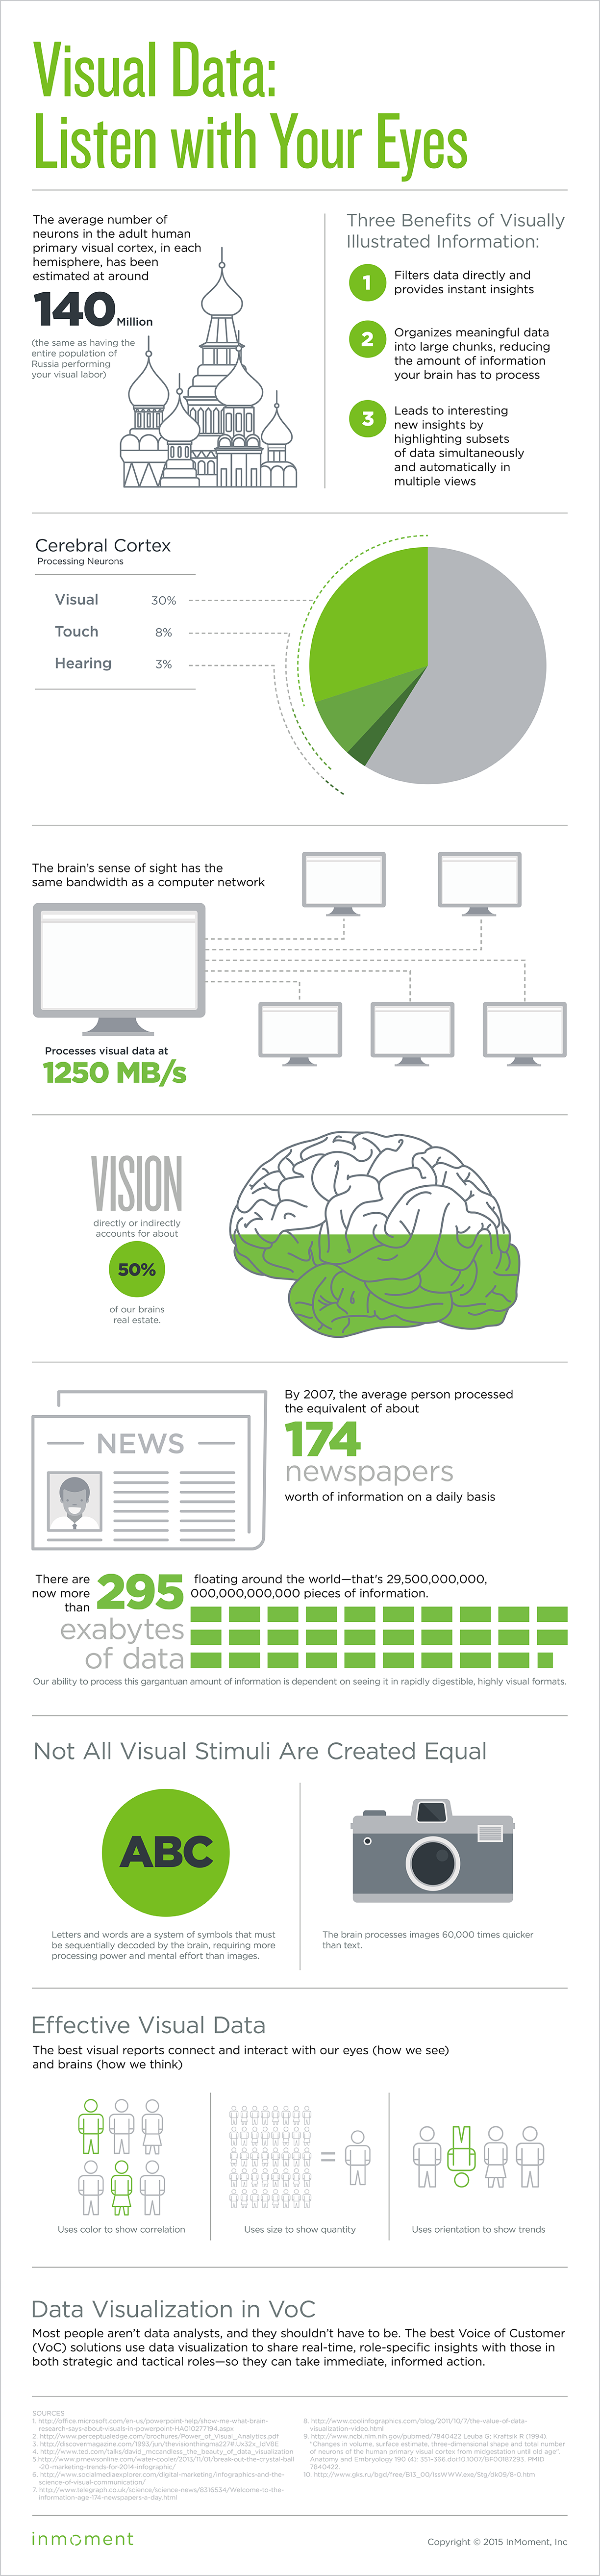
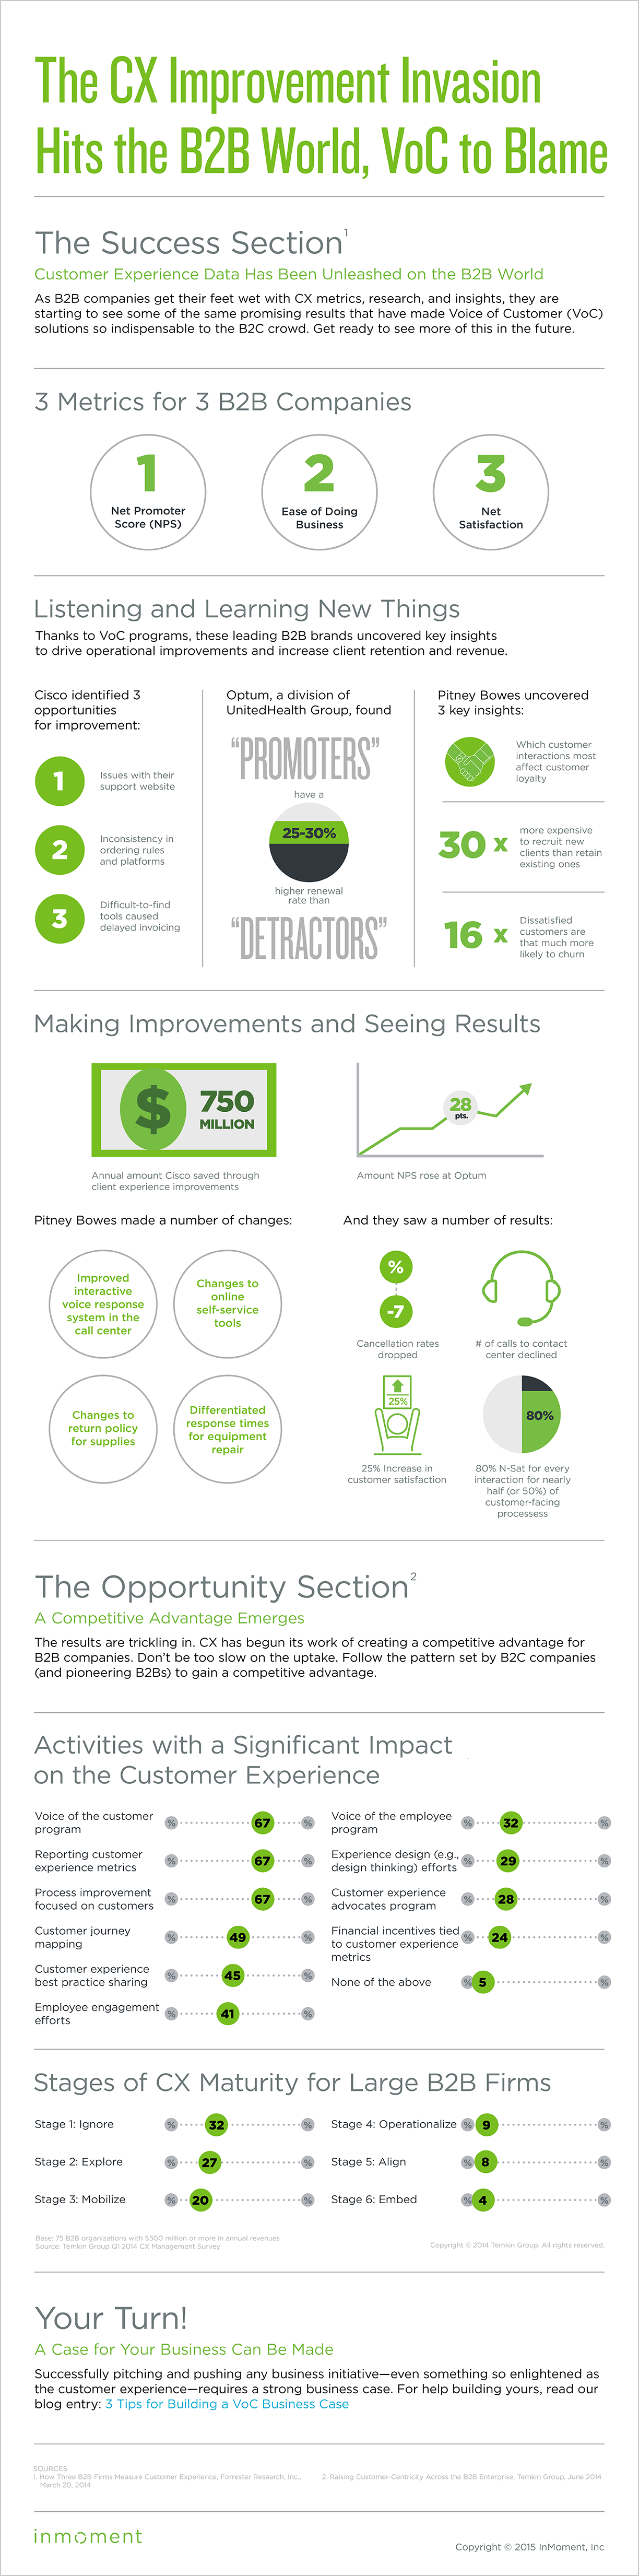
For clients like InMoment, SAP Concur, and Sterling, the challenge was to present data from reports and studies in a format that was immediately understandable for busy audiences, such as executives or potential customers.
-
As an information designer and illustrator, my solution was to create a series of custom infographics. I focused on establishing a strong visual hierarchy, using clear typography, and developing custom illustrations to simplify complex topics and make key data points stand out.
-
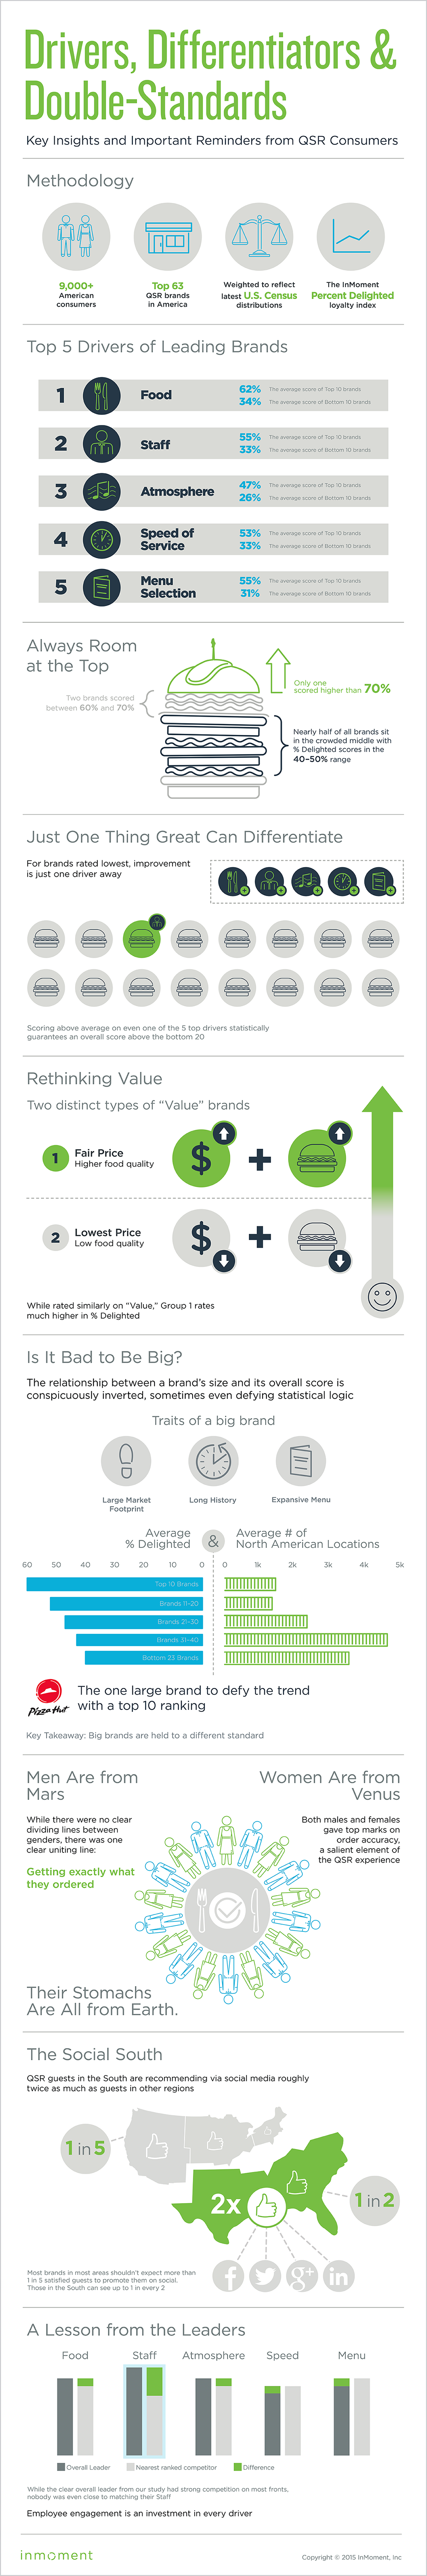
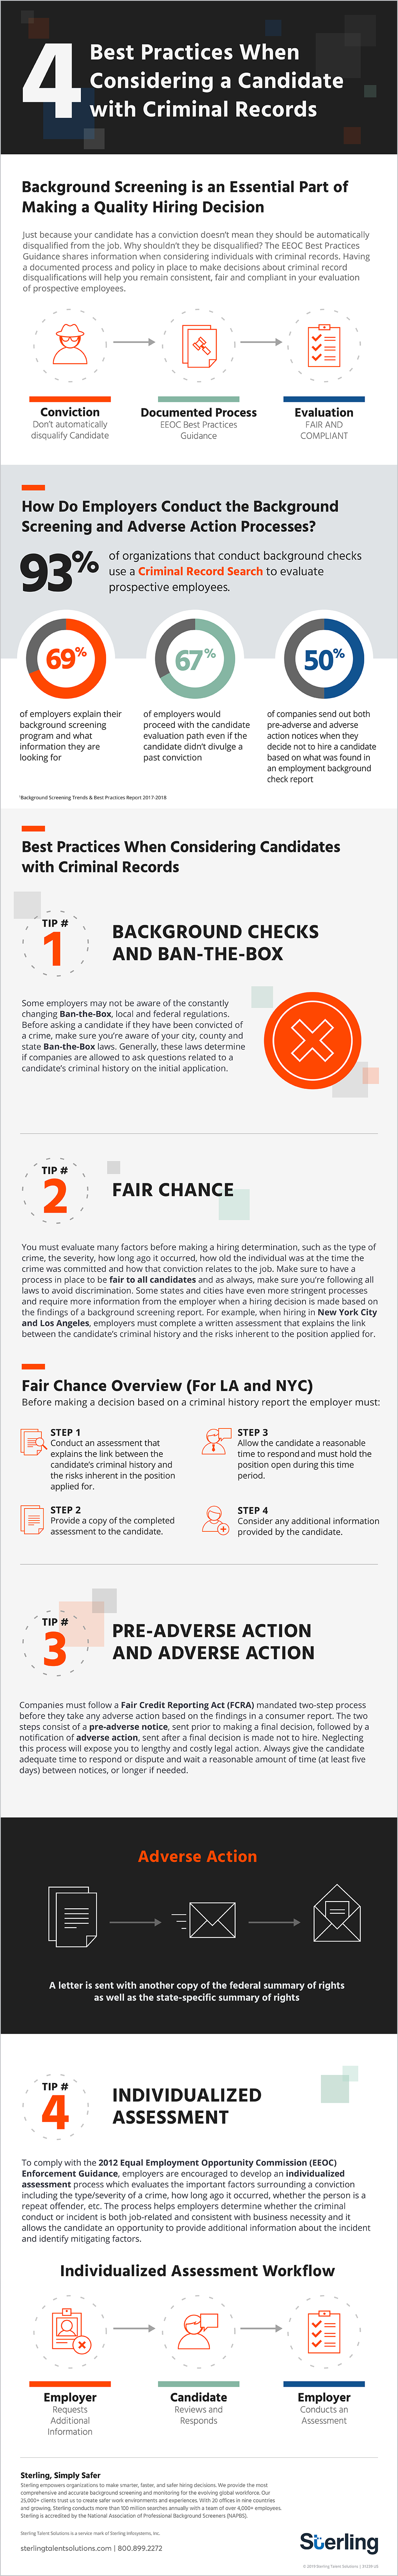
Editorial Layout: Transformed dense, complex reports into clean, structured visual formats that guide the reader’s eye.
Illustration & Iconography: Developed a library of custom vector assets tailored to each client’s specific brand guidelines, moving away from generic stock imagery.
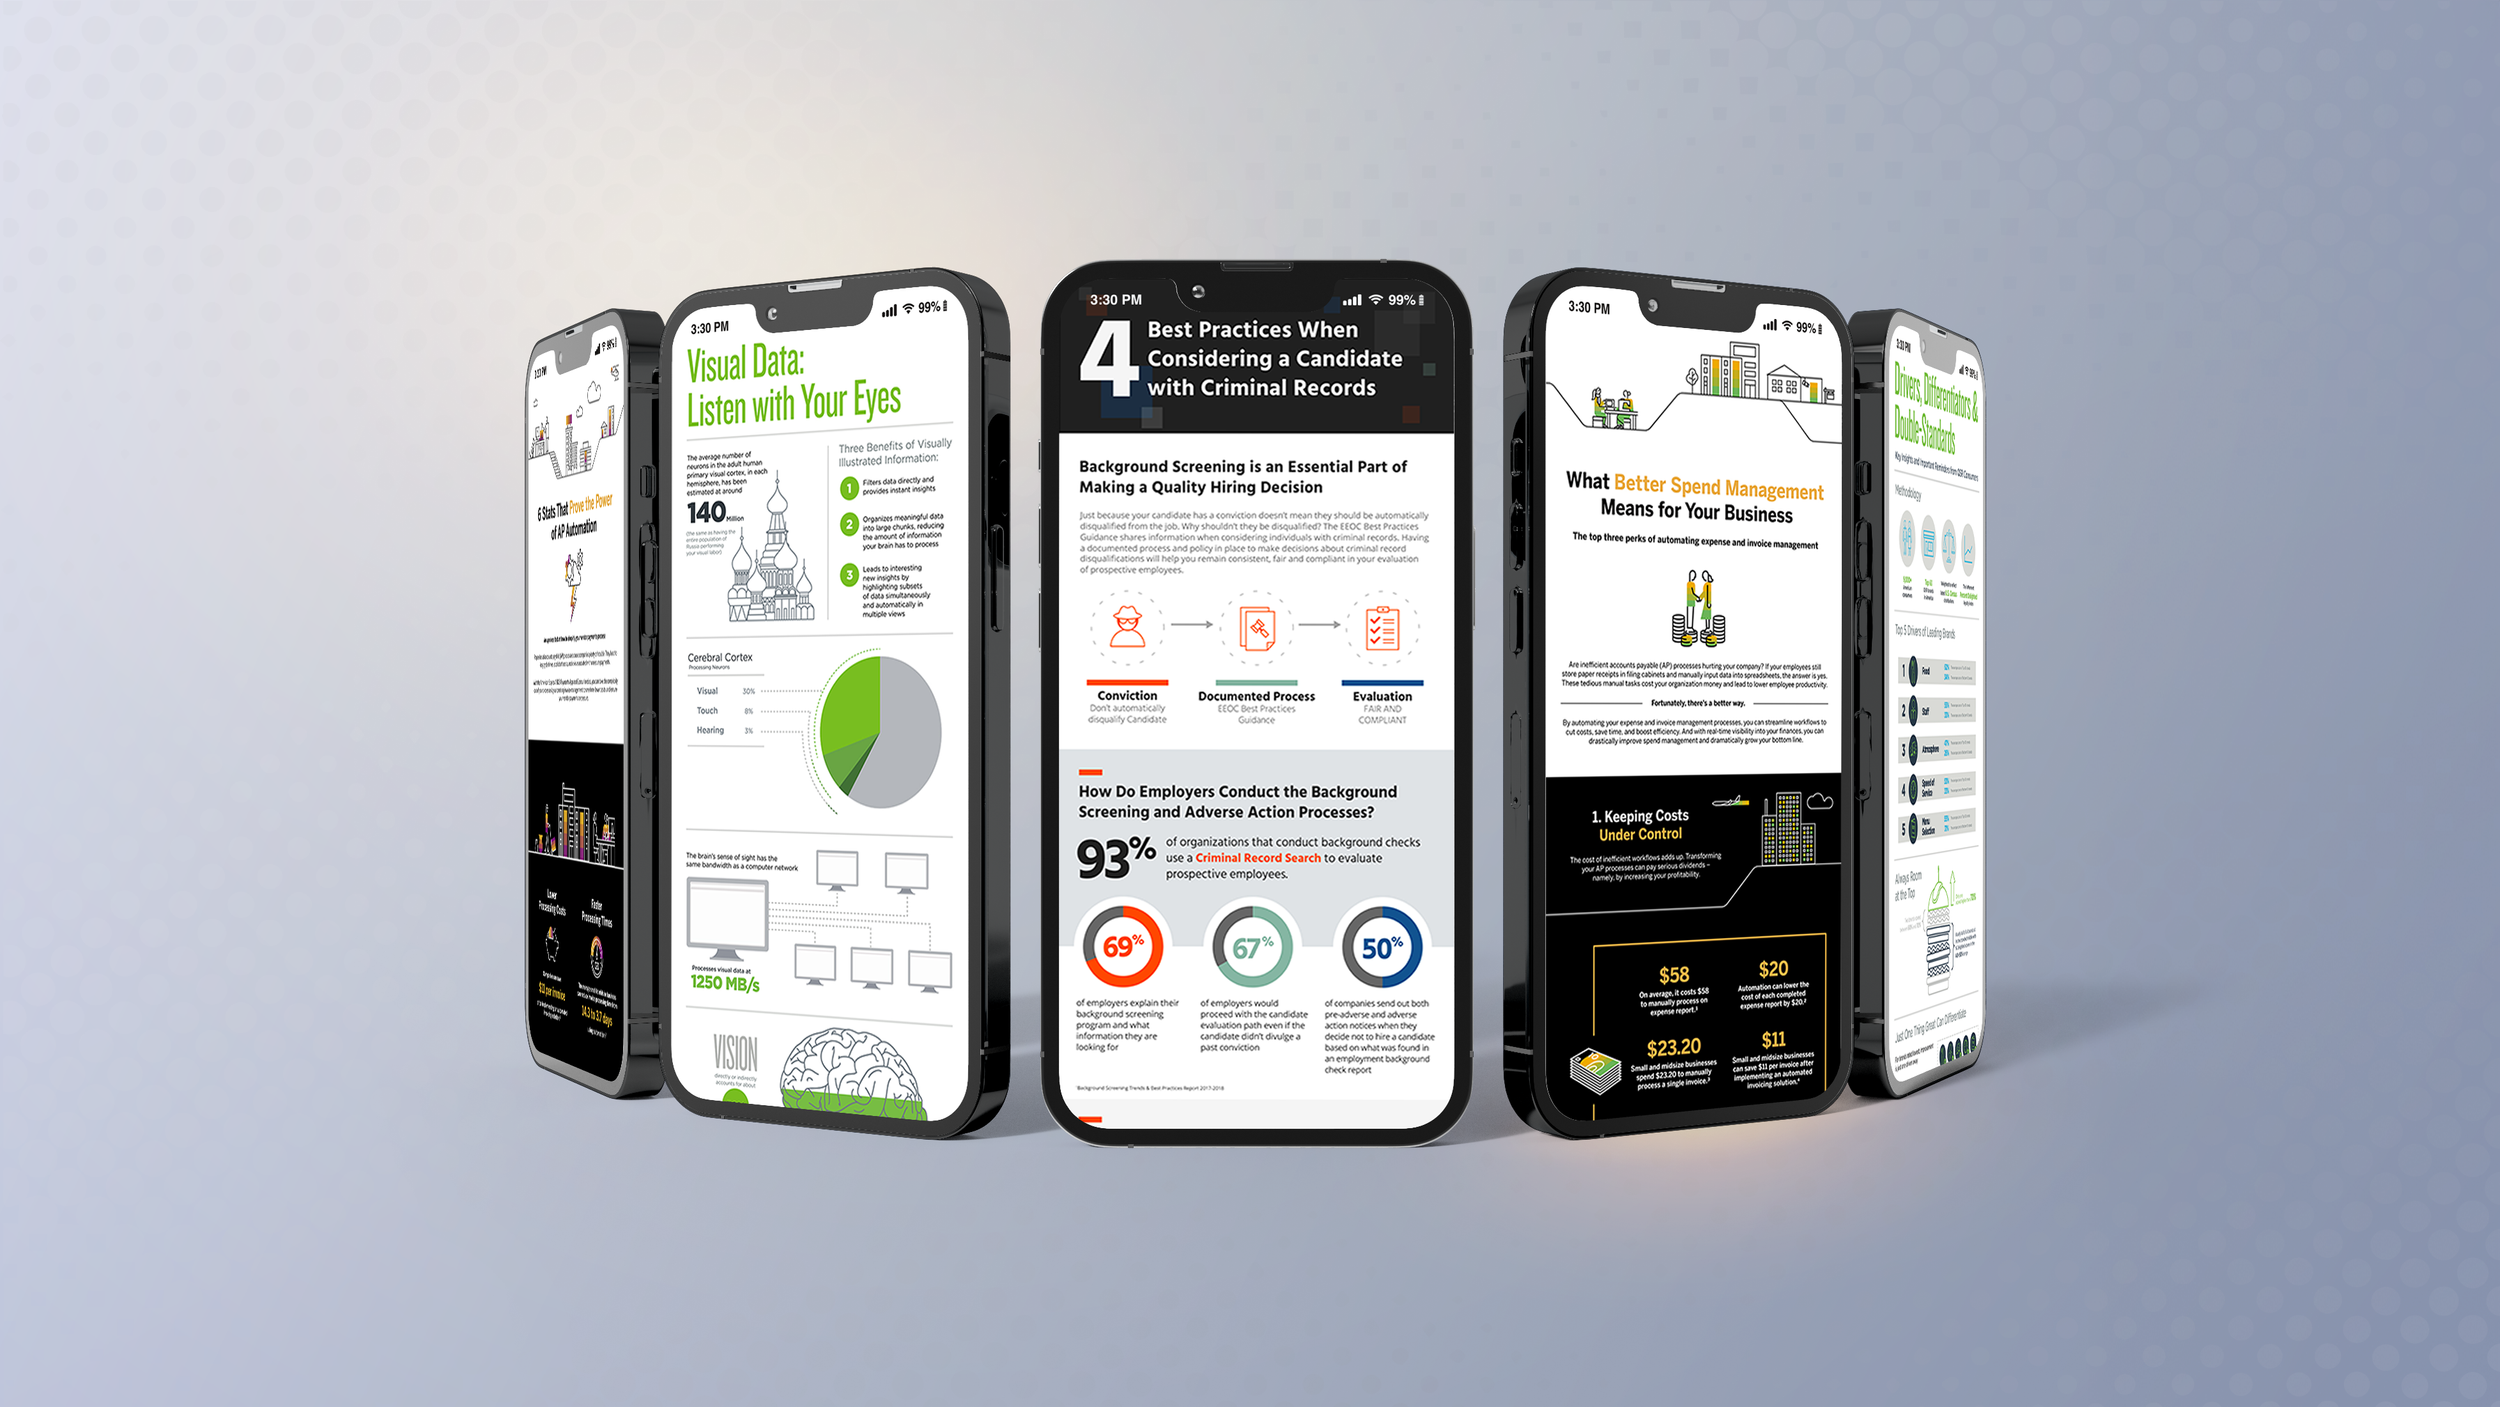
Visual Storytelling: Converted static reports into "shareable" marketing assets, using pacing and flow to increase reader retention.
Brand System Adaptation: Successfully executed distinct visual styles for multiple enterprise clients (SAP, Sterling, InMoment) without compromising their core identity.